Design Selection | 11 min read | Advanced
Adaptive Simon's Two-Stage Design: A Worked Example Compared With Simon Optimal
Follow a worked adaptive Simon's two-stage design with p₀ = 0.20 and p₁ = 0.40: see the full stage-one decision rule and how its maximum and expected sample sizes compare with Simon Optimal.
Start Here
A conventional Simon's two-stage design enrolls the same number of additional patients in stage two whenever the trial continues. An adaptive design lets that number depend on how many responses were seen in stage one, according to a rule written down before the trial starts.
This article follows one scenario from the study inputs to the complete adaptive decision rule, using designs calculated in BioStatHub, and compares the result with the conventional Simon Optimal design. For the concepts behind adaptive designs, read Adaptive Simon's Two-Stage Designs first.
The comparison is deliberately balanced. The adaptive design in the example has clear advantages in some operating characteristics and almost none in others, and a second adaptive design found in the same search is a trade-off rather than an improvement.
Reading the Tables in This Article
In an adaptive design the second-stage sample size is a function n₂(s) of the number of stage-one responses s, so the design is a table with one row for every possible stage-one result. Adaptive Simon's Two-Stage Designs explains the idea; here it is enough to read each row as an action: stop for futility, continue with n₂(s) more patients, or stop for efficacy.
Threshold convention: Simon’s r is the largest total number of responses at which H₀ is not rejected. The tables in this article, like BioStatHub, state the threshold the other way round: reject H₀ if the total number of responses is at least c, where c = r + 1.
Two sample-size values are reported throughout: EN(p₀), the expected sample size when the treatment has the unacceptable response rate, and EN(p₁), the expected sample size when it has the target response rate. Each weights the total sample size of every stage-one outcome by its binomial probability, and outcomes that stop the trial contribute n₁.
The probability of early termination, PET(p₀), is a different quantity. In a design that can stop for efficacy it is the sum of the futility and efficacy stopping probabilities. It measures how often the trial stops after stage one, not how many patients are enrolled.
The Worked Example: Study Inputs
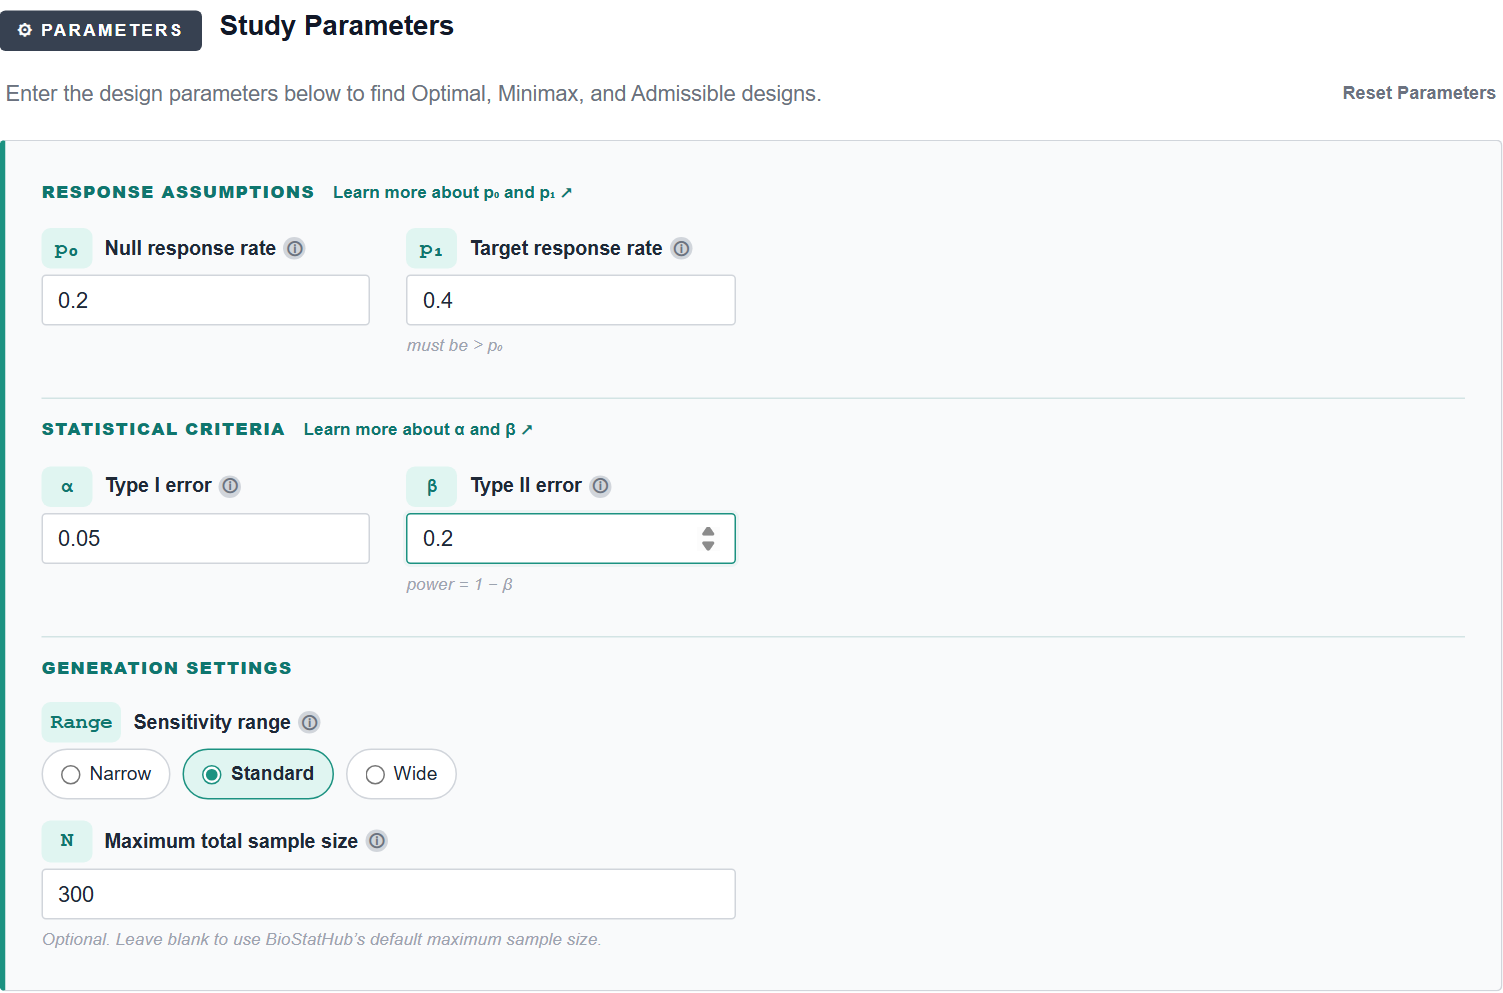
The example uses an unacceptable response rate p₀ = 0.20, a target response rate p₁ = 0.40, a one-sided type I error limit α = 0.05 and a target power of 80% (β = 0.20).
The inputs are entered in the Study Parameters panel of BioStatHub, and Generate Designs returns the conventional candidates.
| Parameter | Value | Meaning |
|---|---|---|
| p₀ | 0.20 | Unacceptable response rate |
| p₁ | 0.40 | Target response rate |
| α | 0.05 | One-sided type I error limit |
| Power | 0.80 | Target power (β = 0.20) |
The Conventional Benchmark: Simon Optimal
BioStatHub returns the Minimax, Admissible and Optimal Simon designs for these inputs. The Optimal design minimizes the expected sample size under p₀ and is the benchmark for the adaptive comparison.
The Simon Optimal design is r₁/n₁ = 3/13 and r/N = 12/43: stop for futility with 3 or fewer responses among 13 patients, otherwise enroll 30 more, and declare the treatment promising if there are more than 12 responses among 43 patients.
| Design | n₁ / r₁ | N / r | EN(p₀) | PET(p₀) | Type I error | Power |
|---|---|---|---|---|---|---|
| Minimax | 18 / 4 | 33 / 10 | 22.25 | 0.716 | 0.0458 | 0.801 |
| Admissible | 14 / 3 | 38 / 11 | 21.24 | 0.698 | 0.0495 | 0.815 |
| Optimal | 13 / 3 | 43 / 12 | 20.58 | 0.747 | 0.0496 | 0.800 |
The Adaptive Design Found
The adaptive design was found with the Extended search scope, starting from the Simon Optimal design: first-stage sizes from 11 to 15 were examined, with a maximum total sample size of 65. The design with the smallest expected sample size under p₀ was selected.
It has a first stage of 14 patients and a maximum of 37. Its type I error and power meet the same constraints as Simon Optimal.
EN(p₁) for Simon Optimal is calculated here from its boundaries (13 patients, stop at 3 or fewer responses, 43 patients in total); the candidate designs table in BioStatHub does not list it.
| Operating characteristic | Simon Optimal | Adaptive Optimal |
|---|---|---|
| Stage 1 sample size | 13 | 14 |
| Maximum total sample size | 43 | 37 |
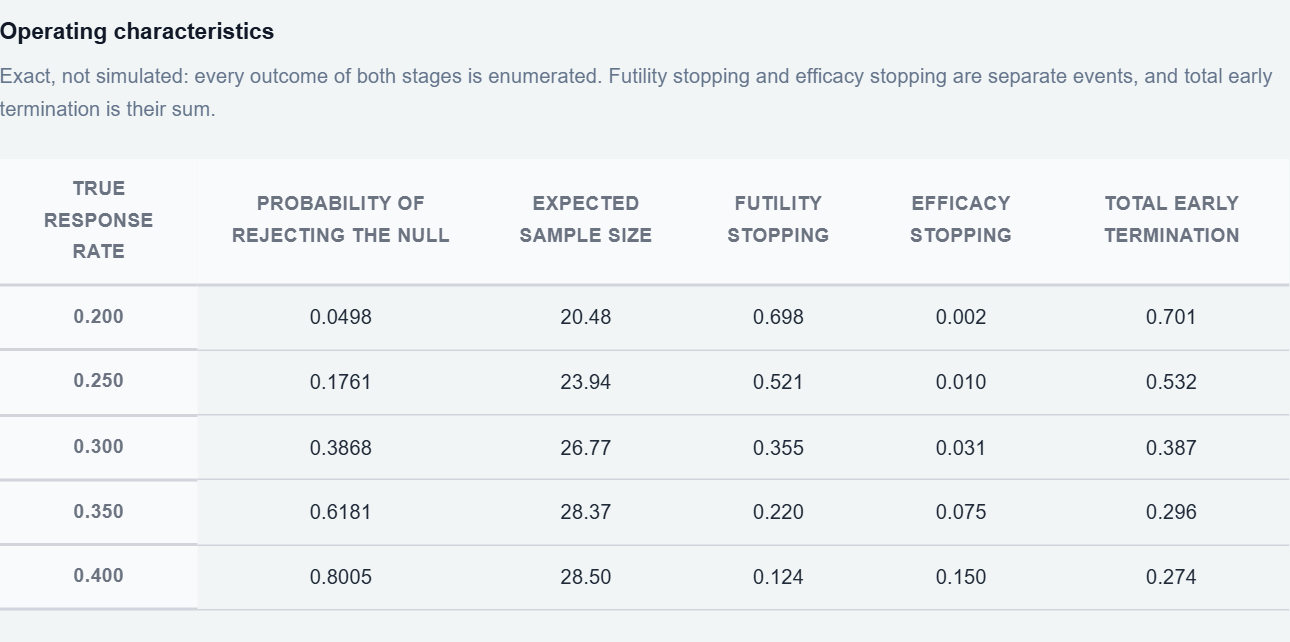
| Expected sample size under p₀ | 20.58 | 20.48 |
| Expected sample size under p₁ | 37.94 | 28.50 |
| Type I error | 0.0496 | 0.0498 |
| Power | 0.8002 | 0.8005 |
| PET(p₀) | 0.747 | 0.701 |
The Adaptive Decision Rule
Every number in the comparison follows from the rule below. With 3 or fewer responses among the first 14 patients the trial stops for futility. With 8 or more it stops for efficacy and H₀ is rejected. Between 4 and 7 it continues, and the second-stage size and rejection threshold depend on the exact count.
| Stage 1 responses | Decision | Additional patients | Total N | Reject H₀ if total ≥ |
|---|---|---|---|---|
| 0–3 | Stop for futility | 0 | 14 | — |
| 4 | Continue | 23 | 37 | 12 |
| 5 | Continue | 20 | 34 | 11 |
| 6 | Continue | 20 | 34 | 11 |
| 7 | Continue | 17 | 31 | 10 |
| 8–14 | Stop for efficacy | 0 | 14 | — |
What the Adaptive Design Improves, and What It Does Not
The comparison shows where the adaptive design helps and where it barely does.
Lower maximum sample size
The ceiling falls from 43 to 37 patients, a reduction of about 14%.
Much lower expected sample size when the treatment works
Under p₁ the adaptive design needs 28.50 patients on average against 37.94, about 25% fewer. This is the largest benefit in the example. It comes from stopping for efficacy after stage one (8 or more responses) and from smaller second stages after higher interim counts.
Almost no change when the treatment does not work
Under p₀ the expected sample size falls only from 20.58 to 20.48, about 0.5%. Simon Optimal is already chosen to minimize EN(p₀) among conventional designs, so there is little left for an adaptive design to gain on that criterion.
Lower PET with a lower expected sample size
The adaptive design stops after stage one less often under p₀ (0.701 against 0.747), yet its expected sample size is also slightly lower. There is no contradiction: PET counts how often the trial stops, while expected sample size also reflects how many patients are enrolled when it continues. Here the adaptive design continues with fewer additional patients on several paths, for example 17 after 7 responses.
Similar error rates
The type I errors are close (0.0496 and 0.0498) and both are below 0.05. A value closer to the limit is not by itself evidence of a better design: it reflects the discreteness of the response data and the different decision rules.
A Second Adaptive Design: Minimax
The same search also returns an adaptive Minimax design, selected to minimize the maximum sample size. It is a trade-off rather than an improvement. Its ceiling is 32 patients against 33 for Simon Minimax and its expected sample size at p₁ is lower, but its expected sample size under p₀ is higher.
EN(p₁) for Simon Minimax is calculated here from its boundaries (18 patients, stop at 4 or fewer responses, 33 patients in total).
| Operating characteristic | Simon Minimax | Adaptive Minimax |
|---|---|---|
| Stage 1 sample size | 18 | 14 |
| Maximum total sample size | 33 | 32 |
| Expected sample size under p₀ | 22.25 | 23.78 |
| Expected sample size under p₁ | 31.59 | 26.96 |
| Type I error | 0.0458 | 0.0492 |
| Power | 0.801 | 0.8003 |
Why the Search Scope Matters
BioStatHub can search from a conventional design with three scopes. A focused search keeps that design’s first-stage size; an extended search examines nearby first-stage sizes; a full search examines every first-stage size the maximum total allows.
In this example the scope decided the outcome. With the first stage fixed at the Simon Optimal design’s 13 patients and a maximum of 65, a focused search found no adaptive design that met both error constraints. The extended search, allowing 11 to 15 patients in stage one, found the design reported above, with a first stage of 14.
A design found by a restricted search should therefore not be read as the best adaptive design for the study. It answers what an adaptive version of the chosen conventional design could look like within that scope.
Verifying an Adaptive Design
An adaptive design is only as credible as its complete rule. To check one, confirm that every possible stage-one result has a defined action, then sum the binomial probabilities of every path that ends in rejection to obtain the type I error (at p₀) and power (at p₁), and weight each total sample size by its path probability to obtain the expected sample size.
The Simon Optimal design in this example matches an exhaustive enumeration of all two-stage designs for these inputs. The adaptive rule’s type I error (0.0498), power (0.8005) and expected sample size under p₀ (20.48) were reproduced independently from the table above with a separate binomial calculation.
In a trial, the rule must be specified before it begins. The protocol and statistical analysis plan should say how the interim result determines recruitment and the final decision.
Explore Adaptive Designs in BioStatHub
BioStatHub generates the conventional designs for your inputs, lets you search for adaptive alternatives to any of them, and shows each rule with its full operating characteristics so the trade-offs can be reviewed before a design is chosen for the protocol.
Adaptive design is a preview feature, and adaptive designs are alternatives to a conventional design rather than replacements for it. A conventional Simon design remains attractive when simplicity, transparency and a fixed recruitment plan are the priorities.
Frequently Asked Questions
Does an adaptive design always need fewer patients than Simon Optimal?
No. In the worked example the adaptive Optimal design lowers the maximum sample size from 43 to 37 and the expected sample size at p₁ from 37.94 to 28.50, but the expected sample size at p₀ is almost unchanged (20.58 against 20.48), because Simon Optimal already minimizes it among conventional designs. Whether an adaptive design helps depends on the criterion and on which designs are searched.
Can an adaptive design have a lower probability of early termination and a lower expected sample size?
Yes. In the worked example the adaptive design stops after stage one less often under p₀ (0.701 against 0.747) yet has a slightly lower expected sample size, because it enrolls fewer additional patients on some continuing paths. The probability of early termination counts how often the trial stops; expected sample size also depends on how many patients are enrolled when it continues.
Why did a focused search find no adaptive design?
A focused search keeps the conventional design’s first-stage size. With the first stage fixed at 13 patients and a maximum of 65 patients, BioStatHub found no adaptive design that met both error constraints for this scenario. Allowing first-stage sizes from 11 to 15 found the design reported here, which has a first stage of 14.
How can I check an adaptive design independently?
Take the complete rule (the action, second-stage sample size and rejection threshold for every first-stage response count) and sum the binomial probabilities of every path. The type I error and power are the probability of rejecting the null at p₀ and p₁, and the expected sample size weights each total sample size by its probability.
Is the adaptation rule chosen after seeing the data?
No. The whole rule is fixed before the trial starts and written into the protocol and statistical analysis plan. Only which row of the rule applies depends on the observed first-stage responses.